← Change Log
FeatureKtrl

Confidence History Chart

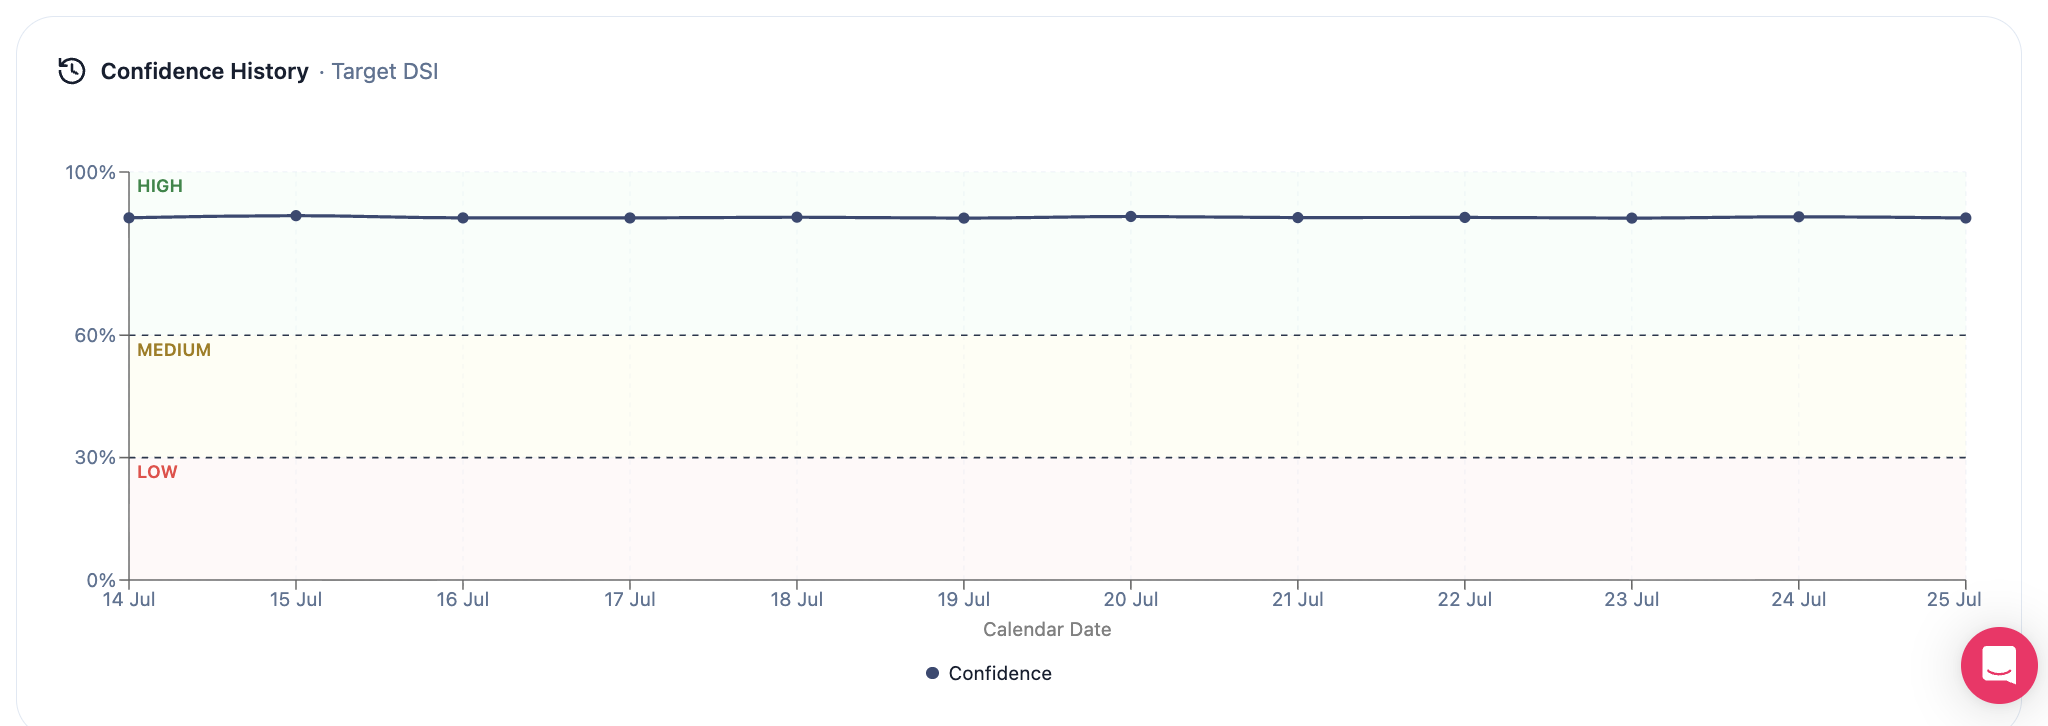
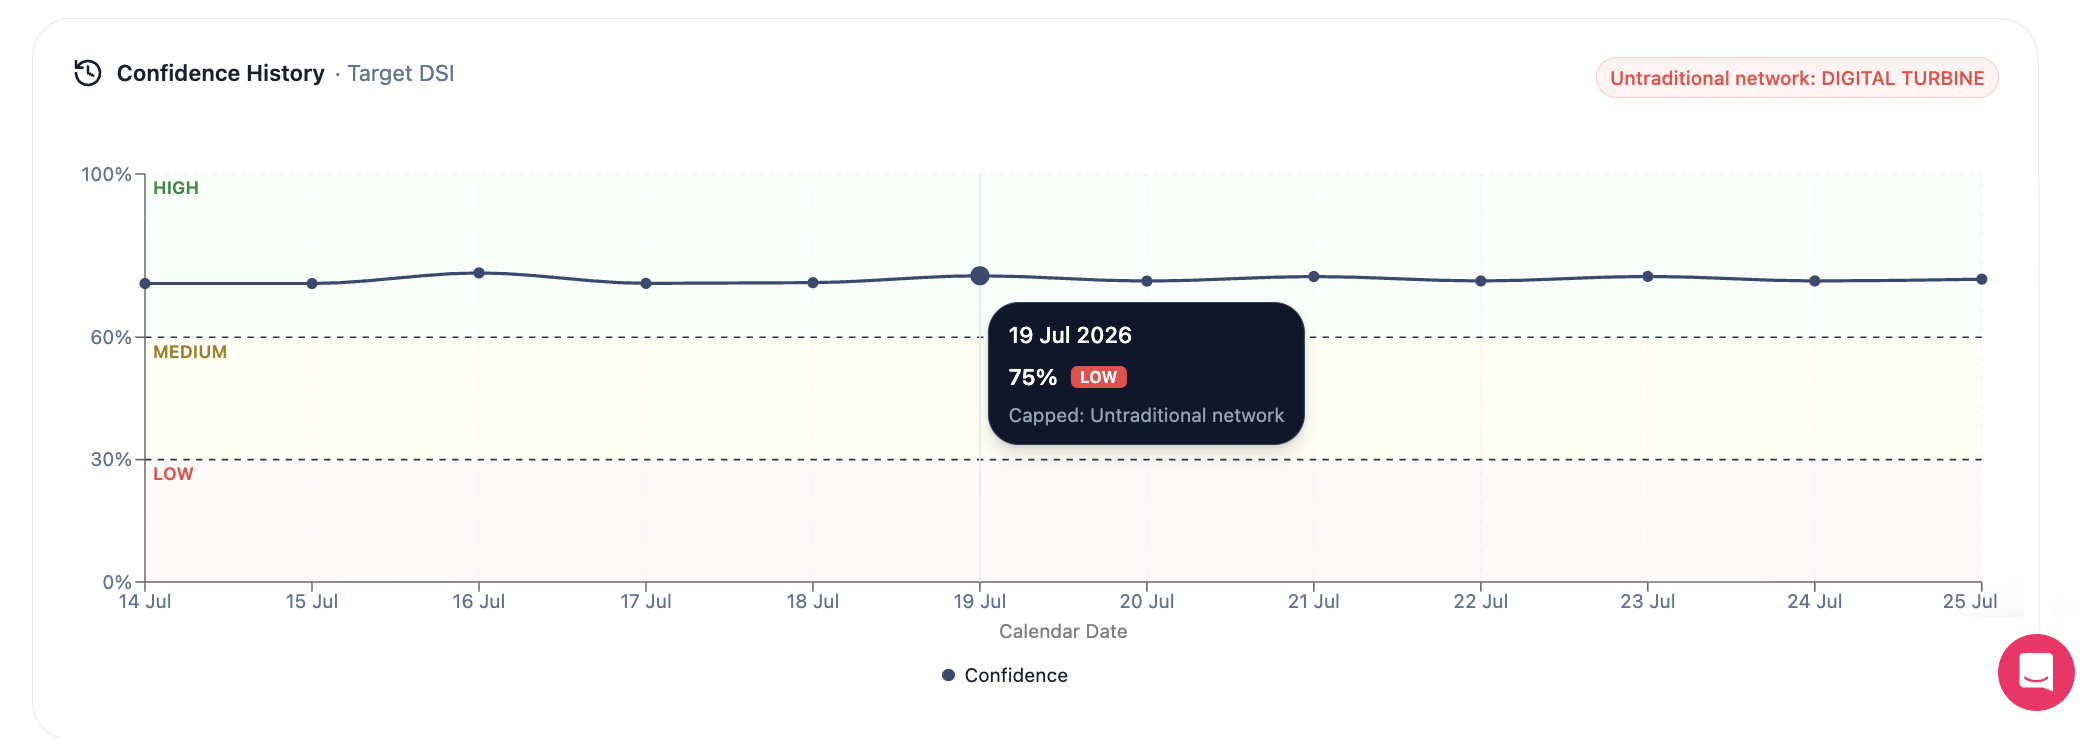
Track confidence in ROAS recommendations over time, with threshold zones and flags explaining when confidence is capped at LOW.
What's new

  • Confidence History Chart tracks confidence in your ROAS recommendations over time.
  • Red, amber and green zones show each confidence threshold.
  • Low spend and non-traditional network flags indicate when confidence is capped at LOW.

What this unlocks

  • Audit recommendation confidence before acting.
  • Understand LOW confidence caps even when a segment's confidence percentage is high.

image.png

Screenshot 2026-08-05 at 15.48.11.png

Ready when you are

Stop hoping your campaigns pay back.

Daily ROAS signals trained on $6bn of UA spend. Free to start, set up in minutes.